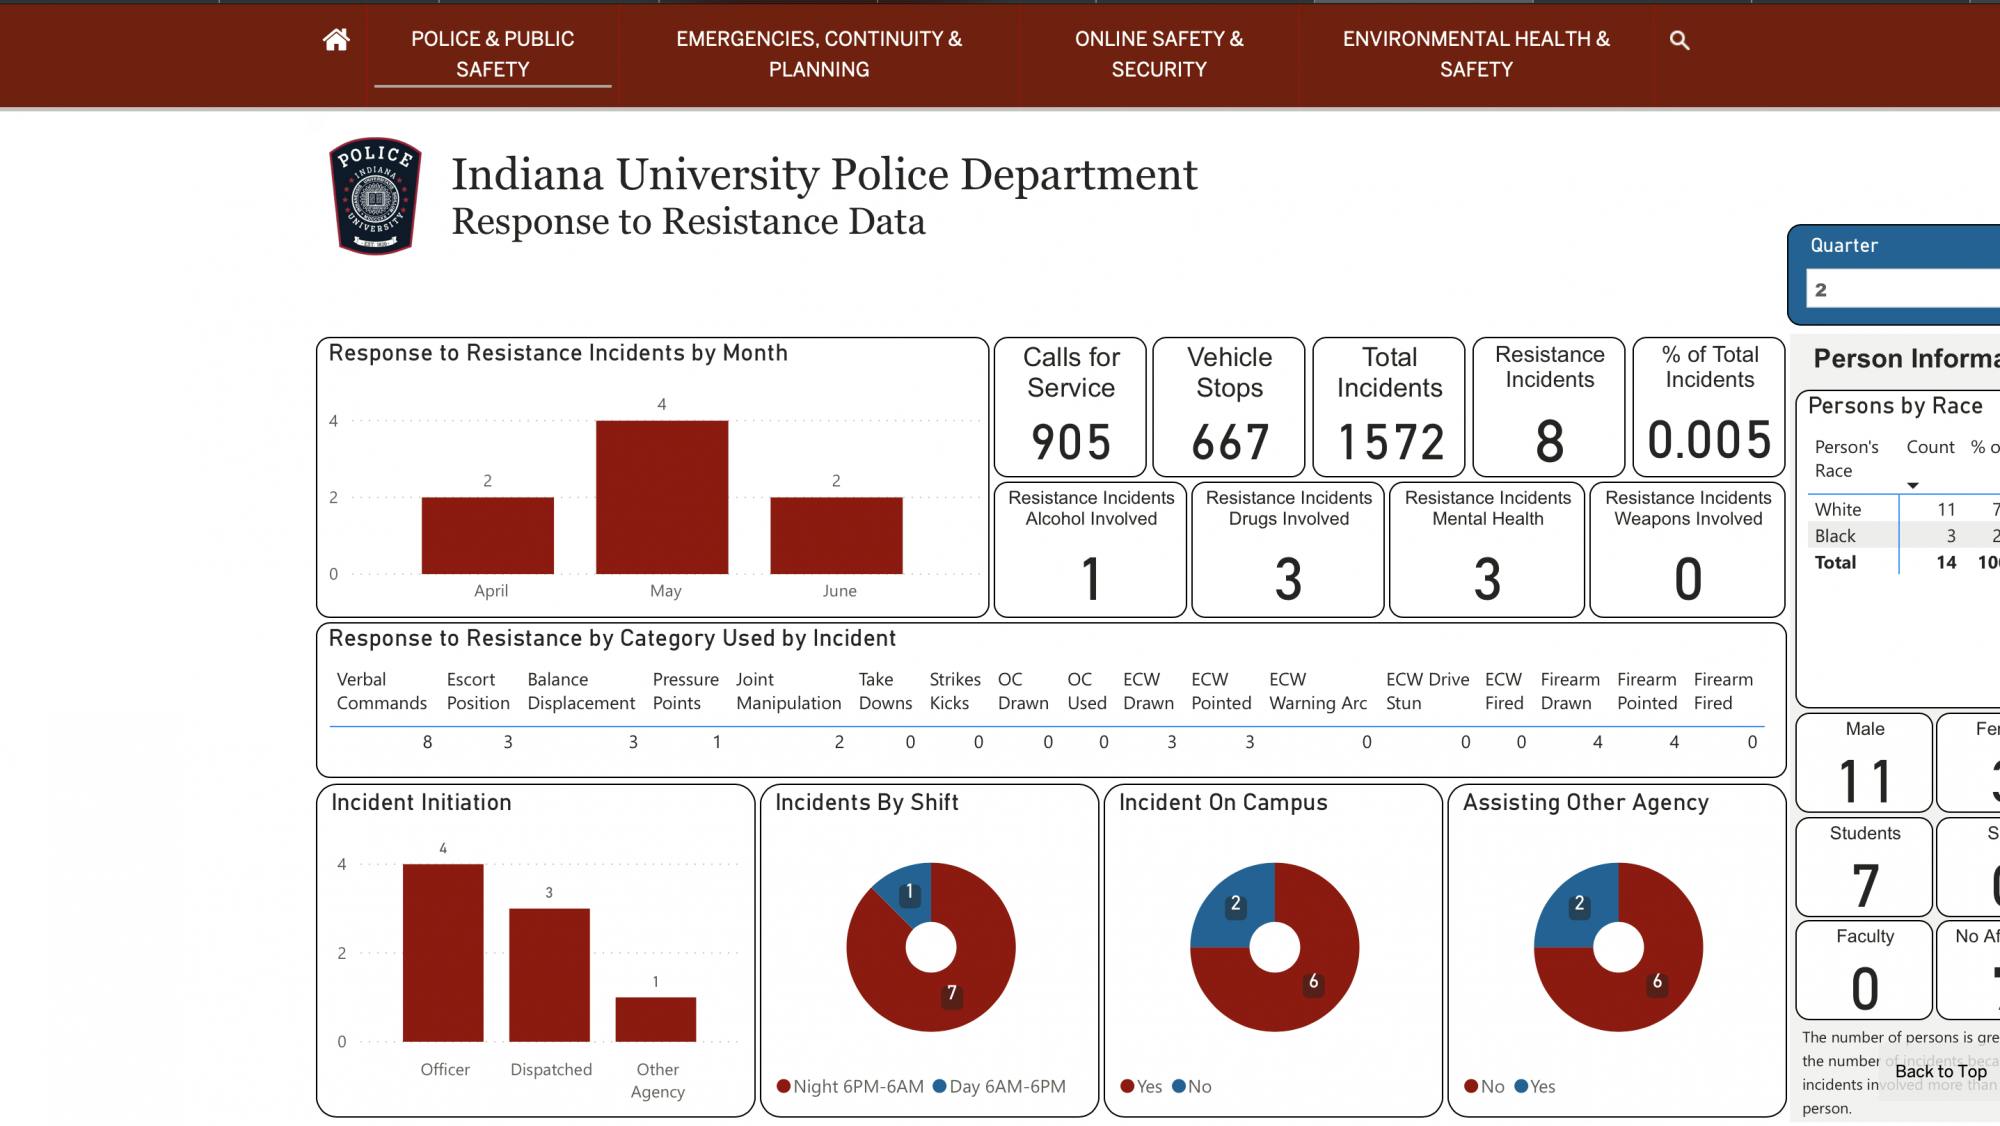
IU Police Department released a response to resistance dashboard for IU-Bloomington on the Protect IU website as part of the Police Data Initiative sometime in August.
Response to resistance data includes items such as whether a taser was pulled from a holster, pointed or used or whether a firearm was pulled from a holster, pointed or used. Response to resistance can also include verbal commands or even officer presence, said Benjamin Hunter, IUPD associate vice president for public safety and institutional assurance and superintendent for public safety.
The release is in an attempt to be more transparent to the public about response to resistance data, Hunter said. He said they are working on releasing dashboards for all campuses.
The dashboard includes a comparison of how many incidents there were in a quarter to how many incidents in the quarter were response to resistance incidents.
The data also includes subjects’ race, gender, affiliation with the university and whether substances such as drugs or alcohol were involved. It also includes whether or not a subject had a weapon or if there was mental concern.
The first quarter data from January through March shows 20 out of 3,103 incidents were resistance incidents, or 0.006%, according to the dashboard. Of all 20 incidents, there were 29 people involved. About 79% were white, about 17% were Black and one person was Hispanic. There were nine students and 20 people unaffiliated with IU.
The second quarter data from April through June for IUPD Bloomington shows eight out of 1,572 incidents were resistance incidents, or 0.005%, according to the dashboard. Of all eight incidents, 14 people were involved. About 79% were white and about 21% were Black. Half were students, and half were unaffiliated with IU.
Natalie Hipple, an associate professor of criminal justice at IU-Bloomington and a member of IUPD’s De-escalation and Training Commission, helped sort through the data to create the dashboards. IUPD received a federal grant to consolidate the data.

She said many response to resistance incidents involved drugs or alcohol and were with non-students.
Hunter said the department has been working on the dashboard idea for three years. He said one of his goals when he arrived at IUPD in the beginning of 2017 was to look at the response to resistance system wide.
“We tracked it, but we didn’t track it consistently,” he said. “It was tracked on paper, PDF documents, Word documents.”
Hipple said it took about nine months to sort through the data on all the campuses for a commission report. They had to make sure items important to cases, such as victims’ names, were not released, Hipple said.
“It took a long time to kind of figure out what we wanted to capture, what we were missing from the paper files, how that translated into electronic files, getting the brainpower of someone who really knew how to work the IT part of it,” she said.
The data is reviewed by chiefs and command staff monthly, Hunter said.
“They have to justify everything, from an officer’s presence to touching someone,” he said. “Any type of response to resistance has to be reviewed and justified.”
Jill Lees, IUPD Bloomington chief of police, said she hopes that through the dashboard the community will see the willingness to be transparent and also look through IUPD’s general orders, which are documents that contain department policies.
“I want people to ask questions,” she said. “I want people to know that we’re trying to put as much information out there because the more transparent we can be, the less people say, ‘I don’t know what IUPD does, IUPD is just like every other police department in America.’”


